Tuner & analysis tools
CueMix FX provides powerful audio analysis visual diagnostic tools for stereo audio signals, from an accurate guitar/instrument tuner to phase and polarity measurement tools, to a full-fledged oscilloscope. Find out how you can improve your sound with these advanced, yet easy-to-use tools.
Instrument tuner
Just open the Tuner window, play a note, and use the large graphic display to get in tune with an accuracy of one 10th of a cent (one 1,000th of a semi-tone). Being in tune has never been easier.
The Tuner displays the detected note by frequency (in Hertz), note name and octave, with an adjustable reference frequency for A4 between 400 and 480 Hz.
The large meter gives you a clear indication of how high or low you are from the detected pitch.
Large red arrows direct you up or down as needed to zero in on the correct pitch.
You can even tune phase-coherent stereo signals.
The CueMix FX Tuner is as advanced and accurate as any dedicated hardware tuner out there.

FFT display
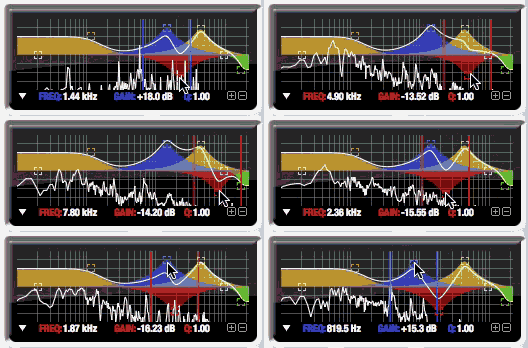
CueMix FX provides an optional real-time FFT display super-imposed on top of the graphic EQ curve so you can see as well as hear the effect of your equalization adjustments.

Spectrogram "waterfall"
CueMix FX also provides real-time spectrogram "waterfall" display that provides rich, detailed visual information about the frequency content of any signal or mix. You can expand the spectrogram to fill the entire resizable CueMix FX on-screen window. You can also combine the spectrogram with the FFT display and EQ curve in the same display, or separate them to view them individually but simultaneously.
X-Y Plot
The X-Y Plot window graphs a stereo signal on a standard grid with left-channel amplitude on the x-axis and right-channel amplitude on the y-axis. Stereo material that is said to be "in polarity" (i.e., phase aligned) appears along the x = y axis:

Stereo material that has phase problems will appear along the x = -y axis meaning the signal will appear predominantly in the upper left and lower right of the display. A signal with an extremely wide stereo field will appear much more randomly (not along either axis).
Phase Analysis
The Phase Analysis window graphs frequency versus phase difference versus amplitude of a stereo signal on either rectangular or polar coordinates. In the rectangular view, the vertical axis represents frequency, and the horizontal axis represents the phase of the left channel minus the phase of the right channel. Stereo audio that is predominantly in polarity will appear centered along the center vertical axis:

Frequencies that would be canceled by summing to mono are those that touch the -1.0 or +1.0 lines on the left and right.
In the polar view, the radius represents frequency and the angle (theta) from the +y vertical axis represents the phase difference of left channel minus the right channel. Stereo audio that is generally in phase will appear along the +y axis (above the center point). The more the audio signal "tips" to the left or right, the more out of polarity it is. If it is completely out of phase, it will point downwards from the center point and hover around the -y axis (the part of the y axis below the center point):

Applications
Phase analysis can be used for a broad range of applications in the studio and on the stage. Here are just a few ideas:
- Recording with multiple mics — the Phase Analysis window lets you compare multiple mic sources with each other to check for potential phase cancellation caused by varying distances in mic placement from the recorded source.
- Checking the overall polarity of a stereo mix — quickly check for phase issues in your stereo mix.
- Summing to mono — if your stereo material needs to be summed to mono, Phase Analysis lets you see what frequencies will be canceled out when summed.
- Tuning and checking PAs or sound reinforcement — place mics in strategic locations in your venue to check for critical phase issues in the listening environment.
Audio as visual art
The X-Y Plot and Phase Analysis displays make for some seriously freaky visual results, depending on the audio signal you run through them. If you do any visual effects work on the side, take note: